The program was easy to install. Since I was not familiar with the program, I went through the first few chapters
of the User's Guide which gives you an overview of the program. It is one of the most thorough and impressive manuals
that I have seen and it is full of step-by-step tutorials throughout and not just in the first few chapters. When
I first looked at the manual, I thought, "this is going to be difficult." I have some background in charting
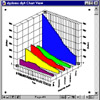
but it is not extensive. I used the tutorials in Chapter 3, though, and produced three charts: (1) a 2-D XY line
chart; (2) a 3-D area chart; and (3) a bullet chart. After I became accustomed to the four views and switching
between them, I really had no problem.
The program has so many features, it would be impossible to discuss everything, so below, I will provide an
overview of what I thought pertinent.
Interface--The interface is user-friendly. You can work in
four different views and can switch easily between them using the
view icons at the top and bottom of eve ry page. The view window
is in the middle, with a menu bar at the top of the screen. The number
of commands displayed in the menu bar changes depending on which view
you are in. There is a
ry page. The view window
is in the middle, with a menu bar at the top of the screen. The number
of commands displayed in the menu bar changes depending on which view
you are in. There is a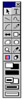 command bar, with icons, located directly below the menu bar. Many
of the icons are common to all views while others are more specialized
and appear only in certain views. There is a navigational bar at the
bottom of every page and contains icons so you can switch views with
a click of the mouse. In the data and chart view, there are also icons
allowing you to add pages, flip through, or display a list of available
pages in that view. In the chart view, there is a toolbox that contains
the tools you use to modify chart objects and create or modify text
and draw objects.
command bar, with icons, located directly below the menu bar. Many
of the icons are common to all views while others are more specialized
and appear only in certain views. There is a navigational bar at the
bottom of every page and contains icons so you can switch views with
a click of the mouse. In the data and chart view, there are also icons
allowing you to add pages, flip through, or display a list of available
pages in that view. In the chart view, there is a toolbox that contains
the tools you use to modify chart objects and create or modify text
and draw objects.
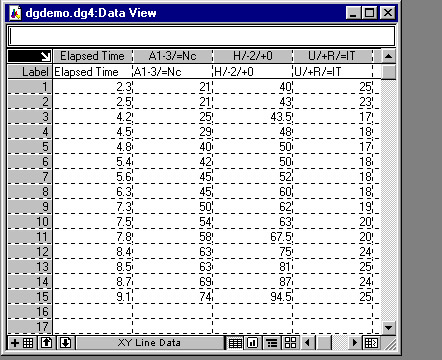
 Data view--consists of data pages
where numerical data is entered for creating charts except text
and organizational charts. This spreadsheet-like cell matrix can
hold 255 columns by 32,000 rows. You can add any number of data
pages to each document;
Data view--consists of data pages
where numerical data is entered for creating charts except text
and organizational charts. This spreadsheet-like cell matrix can
hold 255 columns by 32,000 rows. You can add any number of data
pages to each document;
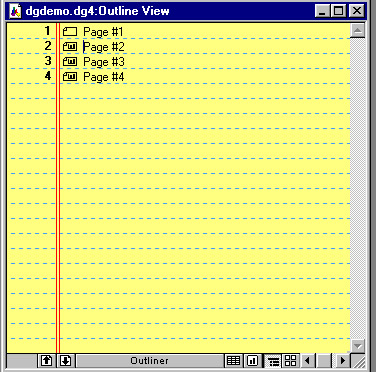
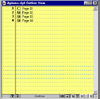 Outliner view--consists of a single
page, where text data is entered. The entries in the Outliner view
also reflect the number of chart pages that have been created and
the contents of each page;
Outliner view--consists of a single
page, where text data is entered. The entries in the Outliner view
also reflect the number of chart pages that have been created and
the contents of each page;
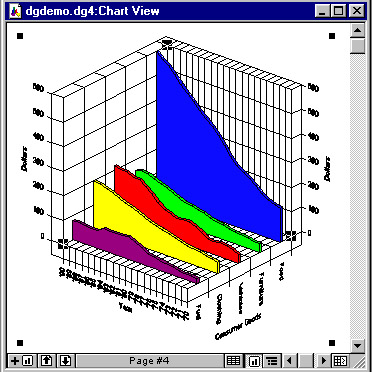
- Chart view--consists of chart
pages, where you view,
 modify,
and enhance your chart once the data is plotted. You can add any
number of chart pages to each document. Each page can hold numerous
charts. In the chart view you have access to a toolbox and to a
layout set window;
modify,
and enhance your chart once the data is plotted. You can add any
number of chart pages to each document. Each page can hold numerous
charts. In the chart view you have access to a toolbox and to a
layout set window;
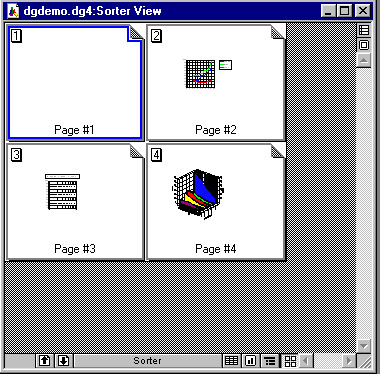
- Sorter v
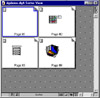 iew--consists
of a single page, where you organize your complete document. This
is where you can make global changes to all your chart pages such
as Smart Layouts.You can reorder pages/slides and apply screen show
transitions to chart pages in this view.
iew--consists
of a single page, where you organize your complete document. This
is where you can make global changes to all your chart pages such
as Smart Layouts.You can reorder pages/slides and apply screen show
transitions to chart pages in this view.
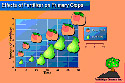
Chart Gallery--To select a chart type, you can use the Chart
Gallery 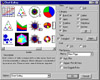 or the Chart
Advisor. The Chart Gallery displays examples of all of the chart types
that you can make with DeltaGraph. As you drag your mouse across each
chart example, its chart type is displayed below the scroll bar. There
are 70 chart types and over 200 chart styles and includes the 10 most
requested chart types such as build-up and stacked build-up charts;
floating bar and floating column charts; four types of segmentation
charts; survival charts; and XY column charts.
or the Chart
Advisor. The Chart Gallery displays examples of all of the chart types
that you can make with DeltaGraph. As you drag your mouse across each
chart example, its chart type is displayed below the scroll bar. There
are 70 chart types and over 200 chart styles and includes the 10 most
requested chart types such as build-up and stacked build-up charts;
floating bar and floating column charts; four types of segmentation
charts; survival charts; and XY column charts.
Chart Advisor--There is a Chart Advisor for users who are
unsure of the type of chart that w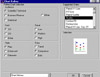 ould
best suit their data. Based on the data you enter into the data page,
and other selections you make in the chart advisor dialog, DeltaGraph
offers one or more appropriate choices for a chart type.
ould
best suit their data. Based on the data you enter into the data page,
and other selections you make in the chart advisor dialog, DeltaGraph
offers one or more appropriate choices for a chart type.
Smart Layouts and Backgrounds--DeltaGraph also provides Smart
Layouts and backgrounds. These layouts consist of place holders for
charts, titles, text, graphics, and 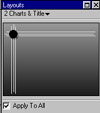 bullets. They serve as templates
for assembling and arranging elements in a chart page. When you apply
a Smart Layout, all elements are scaled automatically and labeled
to fit the page; and when you change an element, every other element
changes to fit the new pattern. A background, which can consist of
any combination of graphics, text, colors, and patterns, sits behind
everything else in a page or layout, acting as a backdrop for the
other elements. Smart Layouts and backgrounds provide consistency
between chart pages, documents, and slide presentations. Backgrounds
and layouts can be saved and used again with other documents. You
can use the preformatted layouts and backgrounds that come with DeltaGraph
or make you own.
bullets. They serve as templates
for assembling and arranging elements in a chart page. When you apply
a Smart Layout, all elements are scaled automatically and labeled
to fit the page; and when you change an element, every other element
changes to fit the new pattern. A background, which can consist of
any combination of graphics, text, colors, and patterns, sits behind
everything else in a page or layout, acting as a backdrop for the
other elements. Smart Layouts and backgrounds provide consistency
between chart pages, documents, and slide presentations. Backgrounds
and layouts can be saved and used again with other documents. You
can use the preformatted layouts and backgrounds that come with DeltaGraph
or make you own.
Graphics Library--DeltaGraph includes a graphics library.
Items are shown in color thumbnails. You can use objects stored in
the library by just dragging them from th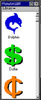 e library window onto your
chart. You can build your own custom library and include any chart,
draw, text, or imported graphic object. When you save a chart in a
library, you have the option of saving the data along with it; thus
you can transfer the data between documents later if you wish. Or
you can save it as a template, then drag the template out of the library
to plot the same chart using different data.
e library window onto your
chart. You can build your own custom library and include any chart,
draw, text, or imported graphic object. When you save a chart in a
library, you have the option of saving the data along with it; thus
you can transfer the data between documents later if you wish. Or
you can save it as a template, then drag the template out of the library
to plot the same chart using different data.
Data & Graphic Import/Export--You can import data in a variety of formats. And you can set links
to the original imported data files so that any changes in imported files will automatically be reflected in DeltaGraph's
data view. Graphics can be imported for illustrations, backgrounds, or even pictographic textures. Charts can be
exported for use in word processing programs or presentation programs.
Editability of Charts--DeltaGraph allows you to have complete control over size, placement, color, and
other chart attributes. There is an excellent toolbox with object-oriented drawing tools including rectangle, oval/circle,
polygon, line, arrow, arc, bezier curve, and freehand tool. You can use 90 fixed and 32 custom colors chosen from
a palette of up to 16.8 million colors for editing. You can save and load custom color palettes in CMYK, CMY, or
RGB color schemes. DeltaGraph has a Design Science Equation Editor for annotation of charts with mathematical equations.
You can change the default chart settings for ticks, grids, and symbols in Preferences. You can re-size charts
along any axis independently; revise data in any existing chart; display chart grids on top of data markers; have
user-defined chart depth and custom color blends; and automatic chart updates after changes in data.
Technical/Scientific Features--Technical users will appreciate DeltaGraph's power and flexibility. Curve
fitting, error bars, logarithmic scaling, and mathematical functions can be used to present scientific and technical
data.
Output--DeltaGraph produces high resolution PostScript output; can be sent to a variety of printers,
including Linotronic and film printers.
Slide Show--You can prepare your charts for a slide show for presentation directly on the screen, as
printed output, or as files to be printed by slide service bureaus. There are 32 graphic transition effects; and
user-defined transition speed.